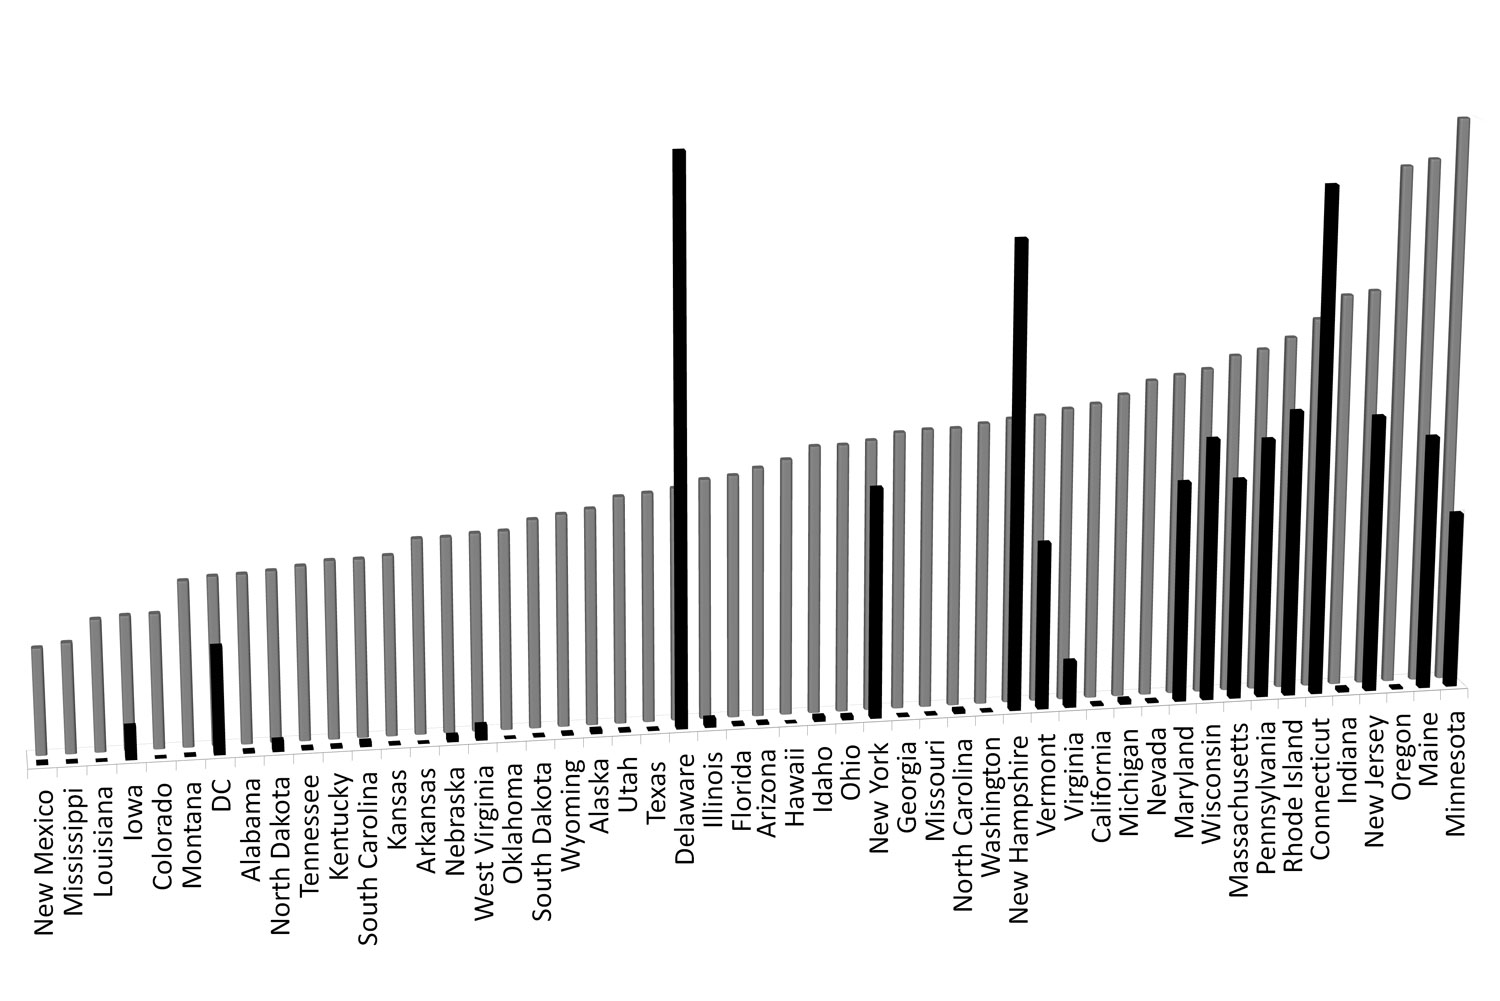
FIGURE 1
This figure compares cases of Lyme disease with
cases of autism in the United States during the 2006-2007 school year. Cases
of Lyme disease are indicated by black bars and cases of autism are indicated by
gray bars. Observe how the states with
the highest incidence of autism are the same states with the highest incidence
of Lyme disease. This unmistakable and shocking "clumping"
of disease cases in the same states was one of the major findings of the
Lyme-autism study.
Sources:
Thoughtful House Center for Children / Fighting Autism Foundation (autism
statistics)
United States Centers for Disease Control (CDC) (Lyme disease statistics)